

These 10 Customer Experience quiz questions are designed to test your understanding of Customer Research. They are written in the style of the Certified Customer Experience Professional (CCXP) examination.
This quiz is part of our Professional Quizzes collection.
It is also a part of our Customer Experience Hub — a collection of articles that explore the architecture, practices, and mindset behind great CX, all grounded in real-world teaching and consulting experience.
This quiz gives Customer Experience professionals, Team Leaders, Managers, Customer Service leaders, and anyone preparing for the CCXP examination an opportunity to evaluate their understanding of Customer Research concepts and principles.
The questions are drawn from our training programs — Customer Experience Management & CCXP Exam Preparation and Customer Experience Management for Team Leaders — as well as our global consulting, training, and Customer Experience research.
Once you’ve completed the quiz, review the detailed explanations in the Answer Key to understand not only which answers are correct, but why.
Instructions
- Each question has one best answer (A–D).
- Complete all 10 questions before checking the answers.
- You’ll find the Answer Key and detailed explanations at the end of the article.
- Take your time, think carefully, and enjoy the challenge.
Question 1
Complete the phrase: “Correlation does not equal _____________.”
A. Causation
B. Regression analysis
C. The outcome of a scatter diagram
D. None of the answers is correct
Question 2
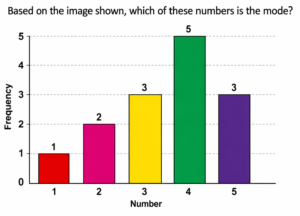
Based on the image shown, which of these numbers is the mode?
A. 5
B. 4
C. 2
D. The sum of all the numbers shown
Question 3
What is the median for this data set?
102, 56, 34, 99, 89, 101, 10
A. 10
B. 102
C. None of the answers is correct
D. 89
Question 4
You earned $129, $139, $155, and $176 over the last 4 weeks. What is your average pay?
A. $153.00
B. $149.75
C. $176.00
D. $99.50
Question 5
Which of the following is the best definition of “Regression Analysis”?
A. The most common number in a data set
B. A technique to assess the relationship between a dependent variable and one or more independent variables
C. A method used to demonstrate cause-and-effect relationships
D. The average of a data set
Question 6
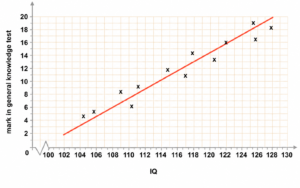
Which answer is the correct interpretation of the diagram shown below?
A. There is a positive correlation between general knowledge test scores and IQ
B. There is no positive correlation between general knowledge test scores and IQ
C. There is a negative correlation between general knowledge test scores and IQ
D. There is no correlation between general knowledge test scores and IQ
Question 7
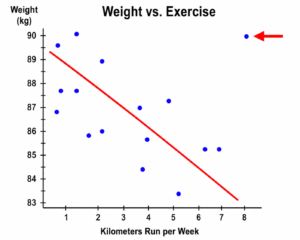
Which answer is the most appropriate interpretation of the diagram shown below?
A. There is a positive correlation between weight and kilometers run per week
B. There is no correlation between weight and kilometers run per week
C. There is a negative correlation between weight and kilometers run per week
D. There is no negative correlation between weight and kilometers run per week
Question 8
Which of the following is the best definition of a Confidence Interval?
A. A range of values that is likely to contain the true population value
B. The overall confidence you have in your figures
C. The percentage indicating how sure you are that the population falls within the interval
D. None of the answers shown
Question 9
Which of the following is the best definition of a Confidence Level?
A. How close sample results are to the population results
B. The degree of certainty that your confidence interval is correct
C. The percentage indicating how sure you are that the population falls within the interval
D. None of the answers shown
Question 10
Why do most organizations survey a random sample of Customers instead of all Customers?
A. A random sample provides more reliable information
B. It is less expensive
C. The confidence interval is higher
D. None of the above
Finished? Now compare your answers with the Answer Key and detailed explanations below.
Answer Key: Why Each Answer Matters
In the answer key below I’ve bolded the correct answer and provided a detailed explanation of why it is the best answer as compared to the other options.
Question 1
Complete the phrase: “Correlation does not equal _____________.”
A. Causation
B. Regression analysis
C. The outcome of a scatter diagram
D. None of the answers is correct
Customer Research Principle
One of the most important principles in Customer Research is recognising the difference between correlation and causation. Just because two variables appear to move together does not mean that one causes the other.
Why is A the best answer?
The phrase “Correlation does not equal causation” reminds researchers not to assume that one event or variable directly causes another simply because they occur together.
For example, Customers who give higher satisfaction scores may also spend more money. While these two variables are correlated, this does not prove that higher satisfaction caused the increased spending. Other factors may influence both outcomes.
Good Customer Research seeks evidence before drawing conclusions about cause-and-effect relationships.
Why not B?
Regression analysis is a statistical technique that helps researchers examine relationships between variables. However, it is not the missing word in the phrase and does not, by itself, prove causation.
Why not C?
Scatter diagrams are useful tools for visualising relationships between variables and identifying possible correlations. However, a scatter diagram does not demonstrate that one variable causes another.
Why not D?
The established phrase is “Correlation does not equal causation.”
Therefore, Option A is correct.
Customer Research Insight
One of the most common mistakes in Customer Research is assuming that because two things occur together, one must have caused the other.
Effective researchers remain curious, test assumptions, and look for additional evidence before concluding that a cause-and-effect relationship exists.
Question 2
Based on the image shown, which of these numbers is the mode?
A. 5
B. 4
C. 2
D. The sum of all the numbers shown
Customer Research Principle
Researchers frequently use descriptive statistics to summarise data. One of the simplest measures is the mode, which identifies the value that occurs most frequently within a dataset.
Why is B the best answer?
The mode is the value that appears most often in a set of data.
Unlike the mean or median, the mode does not involve calculation.
Instead, it simply requires identifying which value occurs more frequently than any other.
In this example, 4 appears more often than any other number and is therefore the mode.
Why not A?
Although 5 is one of the values shown, it does not occur as frequently as 4.
The mode is determined by frequency, not by the size of the number.
Why not C?
Likewise, 2 may appear in the dataset, but it does not occur as often as 4.
Again, the mode is based entirely on the number of occurrences.
Why not D?
Adding all of the numbers together produces a total, not the mode.
The mode identifies the most frequently occurring value, whereas the sum is simply the result of addition.
Customer Research Insight
The mode is particularly useful when analysing categorical or survey data because it quickly identifies the most common response, behaviour, or preference.
For example, the mode might reveal the most frequently selected satisfaction rating, preferred communication channel, or reason Customers contact an organisation.
Question 3
What is the median for this data set?
102, 56, 34, 99, 89, 101, 10
A. 10
B. 102
C. None of the answers is correct
D. 89
Customer Research Principle
The median is one of the most commonly used measures of central tendency. It identifies the middle value in an ordered data set and is particularly useful when the data contains unusually high or low values.
Why is D the best answer?
To determine the median, the data must first be arranged in numerical order:
10, 34, 56, 89, 99, 101, 102
Because there are seven values, the median is the fourth value in the ordered list, which is 89.
Unlike the mean, the median is not affected by unusually large or small values, making it a useful measure when data is skewed or contains outliers.
Why not A?
The smallest value in the data set is 10, but the median is not the smallest value.
It is the middle value after the data has been arranged in order.
Why not B?
The largest value in the data set is 102, but the median is not the largest value.
Again, the median identifies the middle value in the ordered data set.
Why not C?
Option D is correct because 89 is the middle value once the data has been arranged in numerical order.
Customer Research Insight
The median is often preferred to the mean when analysing Customer Research data because it is less influenced by unusually high or low values.
For example, when reporting Customer waiting times or spending patterns, the median may provide a better indication of what a typical Customer experiences than the average.
Question 4
You earned $129, $139, $155, and $176 over the last 4 weeks. What is your average pay?
A. $153.00
B. $149.75
C. $176.00
D. $99.50
Customer Research Principle
The mean, often referred to as the average, is one of the most commonly used descriptive statistics. It provides a single value that represents the centre of a set of numerical data.
Why is B the best answer?
To calculate the mean, add all the values together and divide by the number of values.
$129 + $139 + $155 + $176 = $599
$599 ÷ 4 = $149.75
Therefore, the average weekly pay is $149.75.
Why not A?
$153.00 is not the result of adding the four values and dividing by four.
It is therefore not the correct average.
Why not C?
$176.00 is the highest weekly payment, not the average.
The mean considers all of the values in the data set.
Why not D?
$99.50 is not obtained by correctly calculating the average of the four weekly payments.
Customer Research Insight
The mean is widely used in Customer Research to summarise numerical data, such as Customer satisfaction scores, spending, or waiting times.
However, because unusually high or low values can influence the mean, researchers should also consider measures such as the median when interpreting Customer data.
Question 5
Which of the following is the best definition of “Regression Analysis”?
A. The most common number in a data set
B. A technique to assess the relationship between a dependent variable and one or more independent variables
C. A method used to demonstrate cause-and-effect relationships
D. The average of a data set
Customer Research Principle
Regression analysis is a statistical technique used to examine the relationship between variables. It helps researchers understand whether changes in one or more independent variables are associated with changes in a dependent variable.
Why is B the best answer?
Regression analysis assesses the relationship between a dependent variable and one or more independent variables.
It is widely used in Customer Research to identify patterns, estimate relationships, and understand which factors are most strongly associated with particular outcomes. For example, researchers may use regression analysis to explore how Customer satisfaction, response time, or product quality relate to Customer loyalty.
Why not A?
The most common value in a data set is known as the mode.
It is a descriptive statistic and is unrelated to regression analysis.
Why not C?
Regression analysis can identify and measure relationships between variables, but it does not prove that one variable causes another.
Researchers must be careful not to confuse statistical relationships with cause-and-effect conclusions.
Why not D?
The average of a data set is the mean.
Like the mode, it is a descriptive statistic rather than a statistical technique used to analyse relationships between variables.
Customer Research Insight
Regression analysis is a valuable tool because it helps organisations understand which factors are most closely associated with important Customer outcomes.
However, even strong statistical relationships should be interpreted carefully. Good Customer Research requires evidence before concluding that one factor actually causes another.
Question 6
Which answer is the correct interpretation of the diagram shown below?
A. There is a positive correlation between general knowledge test scores and IQ
B. There is no positive correlation between general knowledge test scores and IQ
C. There is a negative correlation between general knowledge test scores and IQ
D. There is no correlation between general knowledge test scores and IQ
Customer Research Principle
A positive correlation exists when two variables tend to move in the same direction. As one increases, the other also tends to increase (or as one decreases, the other also tends to decrease).
Scatter diagrams are commonly used in Customer Research to visualise the relationship between two variables.
Why is A the best answer?
The scatter plot shows that, in general, as IQ increases, general knowledge test scores also increase.
Although the individual data points do not fall perfectly on the regression line, the overall trend clearly moves upward from left to right across the graph. This indicates a positive correlation between the two variables.
It is important to remember that the diagram shows an association, not proof that one variable causes the other.
Why not B?
The diagram clearly shows an upward trend, indicating that a positive relationship exists between the two variables.
Therefore, it would be incorrect to conclude that there is no positive correlation.
Why not C?
A negative correlation means that as one variable increases, the other tends to decrease.
The scatter plot shows the opposite pattern, with both variables tending to increase together.
Why not D?
If there were no correlation, the data points would appear randomly scattered with no obvious trend.
Instead, the points follow a clear upward pattern around the regression line, indicating a positive correlation.
Customer Research Insight
Scatter plots help researchers identify relationships between variables and assess their strength and direction.
However, as discussed earlier in this quiz, correlation does not equal causation. Even a strong positive correlation should not be interpreted as proof that one variable causes changes in the other.
Question 7
Which answer is the most appropriate interpretation of the diagram shown below?
A. There is a positive correlation between weight and kilometers run per week
B. There is no correlation between weight and kilometers run per week
C. There is a negative correlation between weight and kilometers run per week
D. There is no negative correlation between weight and kilometers run per week
Customer Research Principle
A negative correlation exists when two variables tend to move in opposite directions. As one variable increases, the other tends to decrease.
Scatter plots make it easier to identify the direction and strength of relationships between variables.
Why is C the best answer?
The scatter plot shows that, in general, as the number of kilometers run per week increases, body weight tends to decrease.
The overall trend moves downward from left to right, indicating a negative correlation between the two variables.
Although one data point sits well above the trend line and appears to be an outlier, the overall relationship remains clearly negative.
Why not A?
A positive correlation means that both variables tend to increase or decrease together.
The diagram shows the opposite pattern, with higher levels of exercise generally associated with lower body weight.
Why not B?
The data points are not randomly scattered.
Instead, they follow a clear downward trend, indicating that a relationship exists between the two variables.
Why not D?
The scatter plot clearly demonstrates a negative relationship between the variables.
Therefore, it would be incorrect to conclude that there is no negative correlation.
Customer Research Insight
Not every data point will follow the overall trend.
Individual observations that differ noticeably from the overall pattern are known as outliers. While outliers deserve investigation, they do not necessarily invalidate the overall relationship shown by the data.
Question 8
Which of the following is the best definition of a Confidence Interval?
A. A range of values that is likely to contain the true population value
B. The overall confidence you have in your figures
C. The percentage indicating how sure you are that the population falls within the interval
D. None of the answers shown
Customer Research Principle
A confidence interval provides a range of values that is likely to contain the true population result. It helps researchers understand the level of uncertainty associated with results obtained from a sample.
Why is A the best answer?
Customer Research often relies on samples rather than surveying every Customer.
A confidence interval provides a range of values that is likely to contain the true population result. It recognises that sample results are estimates rather than exact measurements.
Narrower confidence intervals generally indicate more precise estimates, while wider intervals reflect greater uncertainty.
Why not B?
A confidence interval does not describe how confident a researcher feels about the results.
It is a statistical measure calculated from the sample data.
Why not C?
This option describes the confidence level (such as 95%), not the confidence interval itself.
The confidence level indicates how often the method would be expected to produce an interval containing the true population result if the study were repeated many times.
Why not D?
Option A provides the best definition of a confidence interval.
Customer Research Insight
Confidence intervals remind researchers that sample results are estimates rather than exact measurements.
Reporting a confidence interval provides more information than reporting a single number because it communicates the likely range within which the true population result lies.
Question 9
Which of the following is the best definition of a Confidence Level?
A. How close sample results are to the population results
B. The degree of certainty that your confidence interval is correct
C. The percentage indicating how sure you are that the population falls within the interval
D. None of the answers shown
Customer Research Principle
A confidence level expresses the degree of confidence associated with a confidence interval. It indicates how reliable the estimation method is when drawing conclusions about a population from a sample.
Why is C the best answer?
The confidence level is expressed as a percentage, such as 90%, 95%, or 99%.
A higher confidence level indicates greater confidence that the confidence interval contains the true population result. For example, a 95% confidence level is commonly used in Customer Research because it provides a good balance between confidence and precision.
Why not A?
How close a sample result is to the population result relates to the accuracy or precision of an estimate, not the confidence level.
Confidence levels express the level of certainty associated with the estimation method.
Why not B?
A confidence level does not describe confidence in a single confidence interval.
Instead, it refers to the statistical confidence associated with the method used to estimate the interval.
Why not D?
Option C provides the best definition of a confidence level.
Customer Research Insight
Confidence intervals and confidence levels work together.
The confidence interval provides the range of likely values, while the confidence level indicates the degree of confidence associated with that range. Understanding both concepts helps researchers interpret survey results more accurately.
Question 10
Why do most organizations survey a random sample of Customers instead of all Customers?
A. A random sample provides more reliable information
B. It is less expensive
C. The confidence interval is higher
D. None of the above
Customer Research Principle
Most organisations use random sampling because it provides a practical balance between cost, time, and statistical reliability. A well-designed random sample can produce highly reliable results without surveying every Customer.
Why is B the best answer?
Surveying every Customer is often expensive, time-consuming, and operationally difficult.
By selecting a properly designed random sample, organisations can obtain reliable insights while significantly reducing the time, cost, and effort required to conduct the research.
Why not A?
A random sample does not provide more reliable information than surveying every Customer.
If it were practical to survey the entire Customer population, that would generally provide the most complete picture. Random sampling is used because it is a practical and efficient alternative.
Why not C?
The objective of random sampling is not to increase the confidence interval.
Confidence intervals are influenced by factors such as sample size and variability, not simply by choosing to survey a sample rather than the entire population.
Why not D?
Option B provides the best explanation for why organisations typically survey a random sample rather than every Customer.
Customer Research Insight
Good Customer Research is not about collecting the largest possible amount of data.
It is about collecting representative data that enables organisations to make sound decisions efficiently. A well-designed random sample often provides the insights needed without the cost and complexity of surveying every Customer.
End of Answer Key & Explanations
Continue Your Customer Experience Management Development
If you’d like to go deeper into some of the concepts covered in this quiz, these articles will help.
Customer Service Isn’t CX. But That’s Not the Point
Being Customer-Obsessed Doesn’t Mean Being Business Blind
Surprise Moments in CX Training: What Makes Participants Go “Oh!”
When Low Service Scores Meet High Financial Results: A Mystery Shopper Story
Are We Becoming the CX Police?
What Kind of Customer Experience Does Your Contact Center Deliver?
Where’s the Beef? A CX Lesson in Value
From Compliance to Connection: Why Rules Alone Don’t Create Great CX
What Do You Make? (Hint: It’s Not the Customer Experience)
What Running an Art Gallery Taught Us About CX in the Real World
Applying the 5 CX Competencies: Lessons From Our Art Gallery
What Emily in Paris Taught Me About CX
How Lifeguards Brought Customer Experience to the Waterpark
What Behaviours Do Customer Experience Professionals Display?
What Lessons Can Contact Center Folks Learn from CX Folks
Why Complaints Framed as Expertise Rarely Improve CX
Thank You for Reading
I regularly share stories, strategies, and insights from our work across Contact Centers, Customer Service, and Customer Experience. If this article resonated with you, I’d be pleased to stay connected.
Feel free to get in touch anytime, or explore more of our work below.
Daniel Ord
[email protected]
www.omnitouchinternational.com