
Contact Centers are complex environments — but they can be easily understood.
That’s why we created our Contact Center Management Series — a collection of articles that bring together practical guidance and insights to help Contact Centers run better and deliver stronger results.
Why Can’t Our Agents Be More Productive?
 When a Contact Center Manager asks that question, it’s often linked to one or both of these follow-ups:
- Why do our Agents take so long? (handling time)
- Why can’t our Agents handle more? (quantity)
Because this old fashioned line of thinking is neither fair to Agents nor accurate.
I’ve written on Point #1 – Why do our Agents take so long? (handling time) – and if you missed that here is a link to an article on that topic.
For this article, I focus on Point #2 – Why can’t our Agents handle more? And introduce the True Calls per Hour Calculation.
Quantity Handled per Agent Is a Problematic Measure

Let’s start with a caveat.
The Customer contacts we’re talking about in this article are those that need to be handled within an hour – at most – of arriving.
Phone Calls, Chats, Walk-In Customers and some Social Media activities all fit into the ‘need to be handled within an hour of arrival’ classification.
In industry-speak these are Service Level based contacts.
Targeting Quantity Handled per Agent for Service Level based contacts is and always has been problematic.
If you’re wondering what the Quantity Handled per Agent metric sounds like here are some examples:
- “We expect our Agents to handle 80 calls a day.”
- “Our target for Agents is 22 chats per hour.”
- “Our best Agents operate at 44 chats per shift while our lower performing Agents operate at 34 chats per shift.”
I think you see exactly what this sounds like when expressed as an Agent metric.
But This Metric Isn’t Fair
For a metric to be fair, the person or role responsible for that metric should have realistic control over that metric’s outcome.
When it comes to Quantity Handled by Agent as a metric, there are mathematical realities that limit the Agent’s control over the number of calls or chats they handle.
These include:
- The Service Level set and its resulting Occupancy rate (higher Occupancy rates correlate with greater quantity for example)
- The health of the Forecasting, Staffing, Scheduling & Real Time Management process at the interval level
- The size of the Queue or Agent Group at any given time (a mathematical reality known as the Pooling Principle)
- The undeniable mathematics of random contact arrival (which is why we use math such as Erlang C and its variations)
If I Could Ask Only One Question
If I had only one question to ask to see if a Contact Center professional knows their operations, it would be this –
Is it appropriate to target your Agents on the quantity of calls, chats, or walk-ins they handle?
If they answer NO – be impressed. That’s the right answer.
And it signals a Center that knows its operations and is focused on both Agent and Customer Experience.
If the answer is YES – avoid being judgemental. I never am.
Because people don’t go to school to learn Contact Center operations.
So many people end up learning on the job. Or follow whatever they were told by their bosses. They’ve probably never had proper operations training.
But let’s be clear. Targeting Quantity Handled per Agent is wrong.
Not because of some moral high ground. But because of the mathematical realities at work in an inbound Contact Center.
Is There a Better Way We Can Look at Quantity Handled?

You might be thinking, “Ok Dan — got it, I surrender.
We don’t or won’t target Agents on Quantity Handled for Service Level based contacts.
But we still can’t quite let this quantity thing go. And our Bosses still have questions.
So for planning and high level management purposes is there some way that we can analyze the quantity handled by Agents across different shifts, locations and even countries?
Well I’m glad you asked.
There sure is and let me show you how that works.
The True Calls per Hour Calculation
When I teach Contact Center operations I use a fictional restaurant chain – Pizza Palace – to illustrate how the calculation works.
This True Calls per Hour calculation is an advanced technique and you’ll need to have a good understanding of Occupancy.
Imagine Pizza Chefs Making Pizzas Across Different Pizza Palace Outlets
Analyze this scenario:
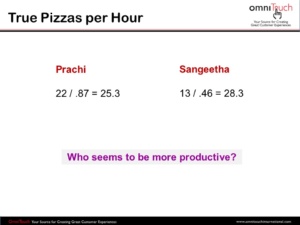
- In our Delhi outlet from 1:00 – 2:00PM: The Occupancy Rate is 87% and Chef Prachi made 22 pizzas
- In our Chennai outlet from 1:00 – 2:00PM: The Occupancy Rate is 46% and Chef Sangeetha made 13 pizzas
Which Chef seems to be more productive?
Pretend You Are in My Class
Pretend you are in my class. Take a moment to come up with your own answer to this question.

The Occupancy Rate – 87% in Delhi and 46% in Chennai – reflects how ‘busy’ our Employees are (Pizza Chefs, Immigration Officers, Contact Center Agents, Grocery Store Cashiers) when they’re in capacity doing the work.
The higher the rate the ‘busier’ the Employees are during the specified time interval.
In this scenario, our Delhi Occupancy Rate is higher. This could be due to its prime location in a busy train station. There are just more Customers walking in.
Or it could be that Chef Prachi in Delhi is busier because two other Chefs who were scheduled did not turn up for work.
While the Occupancy Rate in Chennai is lower. This could be due to its rather remote location in a quiet neighborhood. Few Customers are walking in.
Or it could be that Chef Sangeetha is less busy because two additional Chefs were rostered on the shift with her. Even though few Customers are walking in.
Whether we’re talking about Chefs or Contact Center Agents, we can’t hold Team Members responsible for how busy they are.
That’s out of their control.
Or in the language of the Contact Center, Agents don’t control their Occupancy rate.
So you don’t target Occupancy.
Let’s Normalize the Data
Normalization is a process used to adjust the values in a dataset to a common scale, without distorting differences in the ranges of values. (Sorry that sounds so complicated – hang in there and read on…)
In our Pizza Palace scenario we are dealing with two different Occupancy Rates. 87% in Delhi and 46% in Chennai.
So we can’t do a simple apples-to-apples comparison on which Chef seems to be more productive. They’re not the same ‘level’ of busy.
Let’s Do the Math
We can normalize the data provided by using what I call the True Pizzas per Hour Calculation.
Here’s how that calculation works.
Start with the figure for the quantity they ‘made’ (in this case how many pizzas) and divide that figure by the Occupancy Rate they experienced during that interval.
You can see Prachi made 22 pizzas. And the Occupancy rate was 87%.
So you take 22 / .87 = 25.3
That’s the rate — or speed — at which Prachi is making pizzas.
The use of the word rate or speed is important. Prachi is working at the rate/speed of 25.3 pizzas per hour.
If her Occupancy rate had been 100% this is how many pizzas she would have made.
Using the same calculation, Sangeetha is working at the rate/speed of 28.3 pizzas per hour. 13 /.46 = 28.3
If her Occupancy rate had been 100% this is how many pizzas she would have made.
Our True Pizzas per Hour calculation allows us to fairly compare the quantity rates for both of our Pizza Chefs – apples to apples.
Now substitute the word “calls” or “chats” for the word “pizzas” — that’s the True Calls per Hour Calculation.
The math works exactly the same way.
In All This What Have We Forgotten? Quality
When I’m teaching the True Calls per Hour Calculation in a class, someone almost always figures out what we have forgotten to consider (drum roll please) –

We haven’t spoken about the quality of the pizza.
Are the pizzas that our Chefs are making so good that Customers want to come back again? Tell their friends about us?
Or are the pizzas sloppily thrown together and unappetizing? That’s what the poor comments we get on social media say.
What we haven’t considered in this calculation exercise so far is what the appropriate or best rate is.
Because we want our Customers to love our pizza. We want them to come back again. Give us great testimonials. Tell others about us.
And if we don’t factor in thinking around Quality – then what we’re doing is pointless.
We’ll never run a sustainable pizza business.
We Need to Establish our ‘Quality Range’
Fast food companies conduct rigorous time & motion studies.
These studies help them determine how ‘quickly’ hamburgers (for example) can be made that also meet defined quality standards.
There’s no point making the hamburgers so fast that they don’t taste good. Or so slow that we’re throwing away efficiency.
That’s where the idea of a Quality Range comes in — the sweet spot between speed and standards.
A burger chain might conduct their time & motion studies and determine that the right Quality Range for making burgers – one that meets quality standards and is efficient – is 45 – 50 burgers per hour.
Pizza Palace can use the same Quality Range approach.
After conducting their internal time & motion studies, let’s assume that Pizza Palace established that a Quality Range of 22 – 25 pizzas made per hour is ideal.
Remember that we’re not looking at how many pizzas were made.
We’re looking at the rate at which pizzas are made. That’s a super important distinction.
Let’s Draw Accurate Conclusions About the Performance of Our Chefs
Chef Prachi, operating at the rate of 25.3 pizzas per hour, is probably fine. She’s operating at the upper end of the Quality Range but still (essentially) within range.
Our Quality Assurance folks will continue to taste samples of her pizzas regularly as per our normal process.
On the other hand, Chef Sangeetha is operating at the rate of 28.3 pizzas per hour. She is outside of the defined Quality Range and on the high side.
Our Quality Assurance folks will straight away taste samples of her pizza to ensure that quality hasn’t been compromised.
And based on what we find when we look into this. Whether that’s updating the equipment she’s currently using or provide coaching.
Remember not to jump to conclusions about why she’s overshooting the Quality Range. Do the root cause analysis.
It could be that Chef Sangeetha has come up with an innovation that enables her to produce more quickly that others – without sacrificing quality.
We’d be smart to adopt her innovation for everyone. And help everyone be more efficient.
You Need to Know Your Quality Range
Without knowing your own Quality range you won’t be able to identify who is ‘slower’, who is operating ‘within range’ and who is operating ‘faster’.
Which everyone in your Center will need to know in order to draw the correct conclusions.
Related reading: How to Help Your Contact Centre Agents Improve Their Performance
Don’t Target Agents on Quantity Handled
The best Contact Centers don’t target Agents on the quantity of contacts handled for Service Level based contacts.
Not because of some moral high ground. Arguing morality doesn’t make a lot of sense here.
These Centers know their operations and the mathematical realities at work in a random contact arrival environment.
But they’ve done something remarkable.
By eliminating the ‘wrong’ metrics, they enabled improvement in both Agent and Customer experience.
When these Centers do want to conduct comparative quantity analyses, they can use the True Calls per Hour Calculation.
Examples of What Clients Learned
Clients who have used this approach tell me they learned these lessons:
- For Ireland/Germany/Singapore we know that on a Saturday afternoon shift the Quality Range is 12 – 15 calls per hour
- Our night-shift Team calls per hour achievement will always be lower than our day-shift Team calls per hour achievement — and we know why
- Our True Calls per Hour rate for Japan will always be lower than our calls per hour rate for India due to linguistic and cultural differences
- We know that if we see variations in our True Call per Hour rate over time we need to explore the underlying reasons and not just blame Agents or push them to go faster
When we measure fairly, we create the conditions for both productivity and quality to thrive. And that’s how Contact Centers win for both their Customers and their Teams.
Related reading: Good Decisions Don’t Come from Strong Opinions — why relying on “I believe” isn’t enough in leadership.
Contact Center Management Series Articles
Each link below takes you deeper into the practices that help Centers run better and deliver stronger results.
Metrics, Operations & Reporting
Where Contact Center Operations Break Down
- A diagnostic look at five common operational barriers that prevent contact centers from performing at their best.
15 Quiz Questions on Contact Center Operations (Part 1)
- Test your Contact Center Operations know-how with these 15 Quiz Questions
15 Quiz Questions on Contact Center Operations (Part 2)
- 15 more Quiz Questions to test your Contact Center Operations know-how.
Why Are You Still Talking About Average Handling Time?
- Why AHT is often misunderstood, and how to reframe it as a useful measure.
Contact Centre KPIs & The Green Jaguar
- A story from my Contact Centre Management career about my boss, her green Jaguar and Contact Centre metrics.
What to Know About the Pooling Principle in Contact Centers
- To avoid making mistakes in Contact Center performance, it’s important to understand the Pooling Principle.
I Think Our Contact Center Reports Person Has Lost the Plot
- Why clarity in Contact Center reporting matters — and how confusing reports can misguide behaviors and culture.
Whatever Happened to First Contact Resolution?
- Why First Contact Resolution still matters, and how to measure it meaningfully.
Implementing Appropriate Contact Centre Wait Time Metrics
- How to set realistic Wait Time measures that balance operations and Customer expectations.
Why Smaller Centers Struggle When They Grow
- Why small Contact Centers struggle as they grow — and what changes when scale exposes weak processes.
Thanks Dan, But Do You Have the Contact Center Metrics for BPOs?
- Contact Center people believe that what they see in their own Centers is representative of the industry at large – this article shatters that myth.
Getting a Handle on Abandonment Rate in the Contact Centre
- Understand why Abandonment Rate is a secondary measure of Customer Wait Time — and why chasing it can be a mistake for both operations and CX.
The Ruby Slippers Lesson for Contact Center Metrics
- The Ruby Slippers from ‘The Wizard of Oz’ remind us that Contact Center leaders have always had the power to set the right metrics.
Why Misunderstanding Correlation Leads to Bad Contact Center Decisions
- Poor Contact Center decisions can stem from misunderstood correlations. Learn how to better use correlation in decision-making.
Is the Contact Center Industry Too Siloed?
- Why Contact Centers often operate in isolation — and how industry silos limit learning, transparency, and shared progress.
The Risks of Channel Blending in the Contact Center
- Channel blending looks good on paper, but it carries real risks. Learn why handling multiple channels at once hurts quality, focus, and CX.
Quality, Coaching & Performance
What to Know About Contact Centre Agent Performance
- The essentials of measuring individual Agent performance in a fair and effective way.
When You Coach You’re Either Helping or Keeping Score
- Why coaching should focus on helping Agents improve — not just keep score.
Selecting Quality Standards for Better Customer Conversations
- A practical exercise to help Contact Centers define meaningful Quality Standards for Customer conversations — with an actual Client success story.
What a Great Quality Assurance Professional Can Do
- See how a great Quality Assurance professional can spot issues, protect Customers, and elevate the role beyond policing Agents.
Your Super High Quality Scores May Be Holding Your Team Back
- Inflated Quality scores can mask deeper issues — how to align QA measurement with real Customer outcomes.
What Kind of Customer Experience Does Your Contact Center Deliver?
- We look at the role of Quality standards in determining what kind of Customer Experience your Contact Center delivers.
How Mystery Shopper Research Contributes to Customer Experience
- Learn how Mystery Shopper Research strengthens Customer Experience by revealing what really happens across journeys and touchpoints.
Why Good People Follow Bad Contact Centre Processes
- Even well-intentioned people can reinforce broken processes — and why fixing the process matters more than blaming individuals.
15 Quiz Questions on Quality Assurance Management
- Evaluate your Quality Assurance Know How with these 15 practice questions.
10 Quiz Questions on Live Chat in Your Contact Center
- Evaluate your Live Chat Channel Know How with these 10 practice questions.
Why Your Call Quality Doesn’t Deliver on Customer Experience
- Call Quality scores don’t guarantee a great Customer experience. Here’s why call quality falls short — and what to be aware of.
How to Conduct a Customer Experience Mystery Shopper Program
- How to design and run a Customer Experience Mystery Shopper program that delivers real insight and not what you should know already.
Where Quality Assurance Programs Break Down
- Explores five common barriers that prevent contact center QA programs from improving frontline performance and service quality.
We Have A Quality Program. Why Isn’t Quality Improving?
- When Quality isn’t improving, it can be that we’ve forgotten to build the capability of the person who is supposed to deliver it. I share three ideas to help do exactly that.
Leadership, Strategy & Professional Growth
What a Month on a Mountaintop Taught Me About Contact Centers
- Why investing in formal know-how, and not counting on years of experience, is essential for Contact Center management success.
CX Lessons We Can Learn from the Contact Center Industry
- Not every CX challenge is new. The Contact Centre industry has faced many of them before — and offers valuable lessons for CX professionals.
It’s Time to Rethink Targeting Net Promoter Score at the Frontline
- Is it right to target Net Promoter Score at the frontline? I explore the risks and unintended consequences when you do this.
The Four Pillars of Stong Contact Center Leadership
- Explore the four essential pillars of Contact Center leadership — Operations, Quality & CX, People, and Business Management — and how they support long-term success.
What to Look for When You Hire a New Contact Center Manager
- Discover the 5 domains of know-how every Contact Center Manager needs — and why years of experience alone don’t guarantee success.
How I Went from Contact Centre Amateur to Contact Centre Professional
- My personal journey in the industry and the lessons I learned about formal know-how and professional growth.
Why Years of Experience Aren’t Enough in Contact Center Management
- Explores why “years of experience” alone isn’t enough in Contact Centre management — and what truly drives leadership success.
What Conway Twitty Taught Me About Agent Resilience
- A story from my early VP, Operations career that shows how resilience — and trust in leadership — help Contact Center Agents weather tough times.
Comments on the McKinsey “The Evolution of Customer Care” Article
- I comment on a McKinsey article from the point of view of a Contact Center practioner.
Should Your CX Head Be a Contact Center Expert Too?
- Should your CX Head be a Contact Center expert? This article shares poll results and insights from both CX and Contact Center professionals.
Should Your CX Head Be a Contact Center Expert Too? — Part 2
- In this Part 2 article, with guest contributors, we explore how important it is for your CX Head to be a Contact Center expert.
What Lessons Can Contact Center Folks Learn from CX Folks?
- There are many lessons Contact Centre professionals can learn from CX — here are five key takeaways that can elevate service and strategy.
Three Suggestions for Contact Center Folks to Master CX
- Discover three suggestions to help Contact Centre Leaders deepen their understanding of Customer Experience and master this discipline.
From Contact Center Management to CX Leadership: Do You Have What It Takes?
- Shifting from Contact Centre Management to CX leadership requires new skills and mindset. Here’s what it takes to succeed in this role.
So How Did You Get Into the Contact Center Industry?
- How Contact Center professionals find their way into the industry — and what those paths say about maturity and growth.
Thank You for Reading
I regularly share stories, strategies, and insights from our work across Contact Centers, Customer Service, and Customer Experience. If this resonates, I’d love to stay connected.
You can drop me a line anytime, or subscribe on our site.